How it works
Every view, every layer, every key
Open Overwatch is a live view of the planet built only from public data: satellites, aircraft, ships, earthquakes, storms, weather, cameras and more, on a 3D globe that keeps zooming out through the Solar System to the cosmic web. There is also a classic 2D map. No account, no key, nothing to install.
This page explains what each part shows, where its data comes from and how to drive it: with a mouse, a finger, the keyboard or your voice.
The views
3D globe
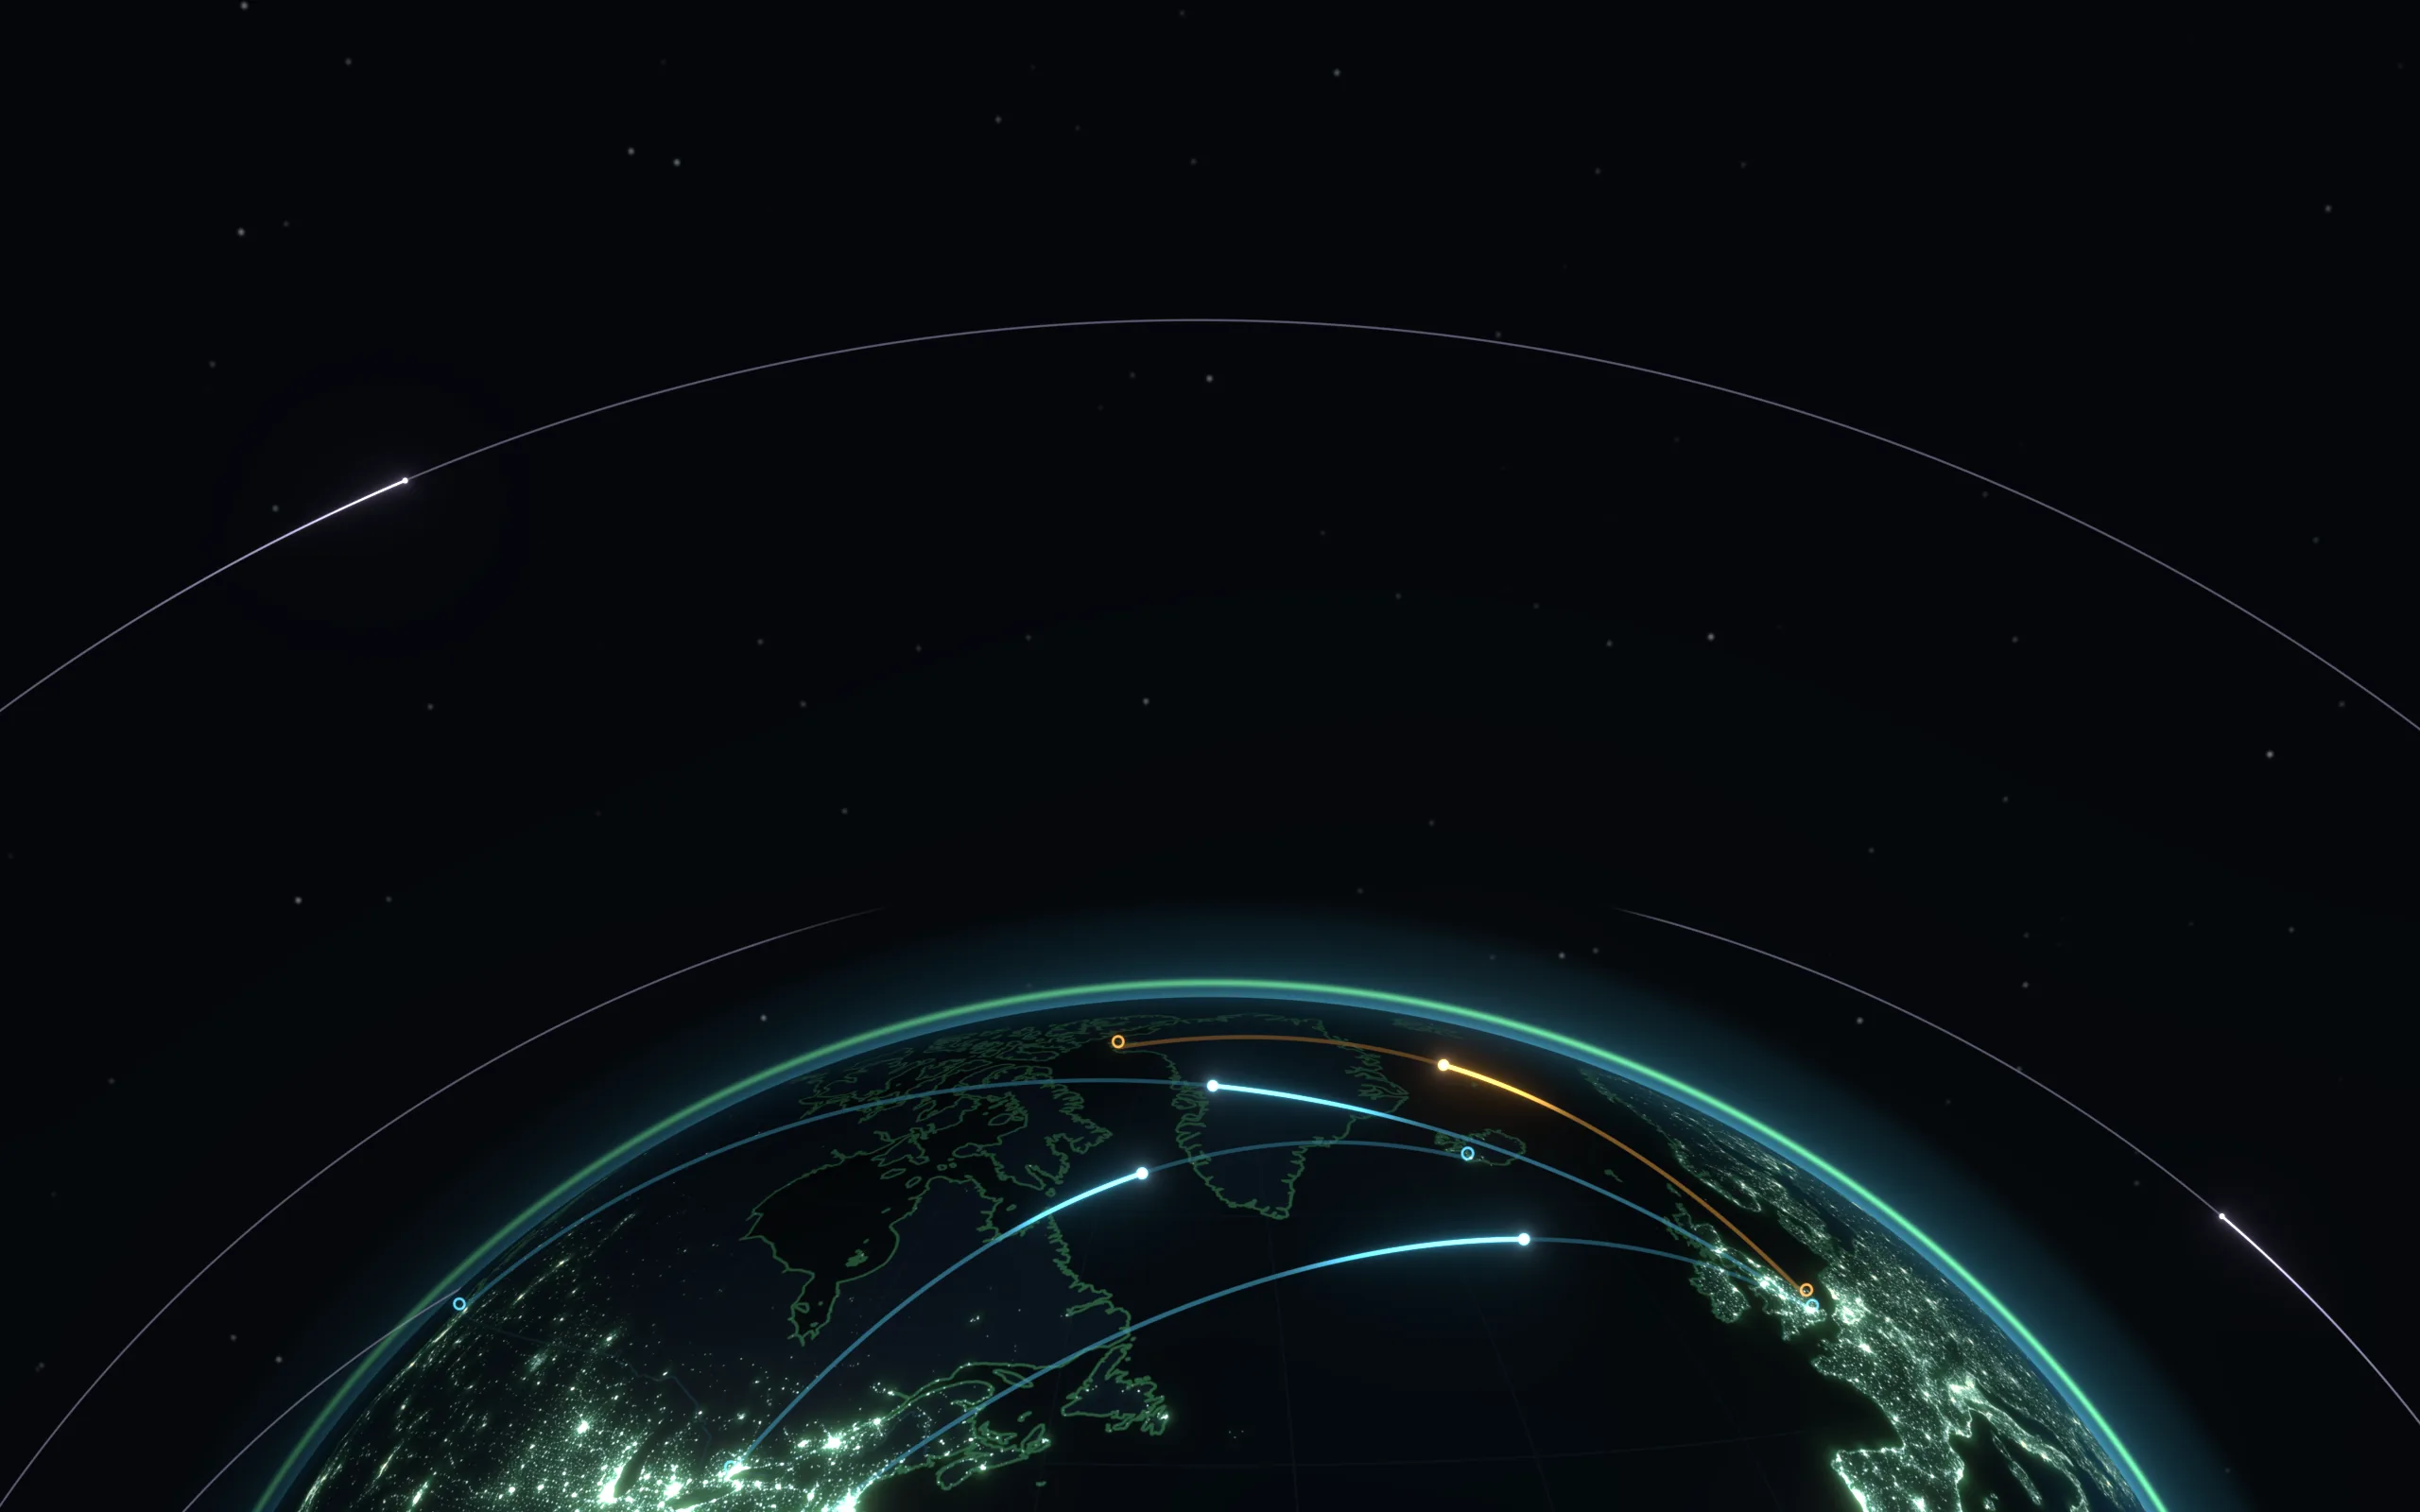
globe.html, built on CesiumJS. The Earth with real day and night, clouds and city lights, every satellite CelesTrak publishes at its real height, aircraft, ships, storms and many more layers. Fly from orbit down to a street. It is the main view and most of this guide is about it.
Solar System
solar.html, built on three.js. The planets and 20 major moons at their real positions, 1.57 million asteroids, comets, spacecraft, nearby stars, 6,339 exoplanets, the Milky Way and 43,480 galaxies. Zoom out far enough on the globe and it takes over by itself.
2D map
open-overwatch.html, built on Leaflet. The original situation map: aircraft, satellites, earthquakes, disaster alerts, news, radar, cables, cameras and ships on a flat map, with a daily brief, a feed log and a setup tab for optional keys.
Tonight
tonight.html. The globe's "Tonight above you" card on its own page, without the 3D globe, so it opens fast on a phone: what you can see in your sky tonight and when.
India
india/, in English and हिन्दी. A starting page for visitors in India: ISRO launches from Sriharikota, India's satellites, the next space station passes over six cities, the night sky from Hanle, cyclones, Himalayan quakes and air quality, each a link that opens the globe already set up over India.
Moving around
Mouse and touch
- Drag to turn the globe, scroll or pinch to zoom, right-drag (or two fingers) to tilt.
- Click anything (a dot, a marker, a country) for its card. Touch picks within a wider area than the mouse, so small dots are easy to tap.
- Esc stops following an object, or closes the card when nothing is followed.
The navigation pad (desktops)
Bottom right: + and − zoom, the compass needle points north and snaps the view north-up and level (N), ⤓ looks straight down (T), ⎘ copies a link to this view, </> copies embed code for your own web page, ◫ shares a picture (P) and ◎ resets to the whole Earth (R). North-up and top-down ask you to stop following first.
The phone dock
On phones the long band and the time buttons are replaced by a dock at the bottom: Explore (every destination and tool in the band, as a sheet), Layers, Time (the clock speeds), Look up and North. The buttons click the same controls as on a desktop, so everything works the same way.
The time bar
Top of the screen. « runs backwards an hour a second, ❚❚ pauses, ▶ is live, › is a minute a second, » ten minutes a second, ⏩ an hour a second, and NOW returns to the present. Satellites, the Sun, the Moon and the weather follow the clock. Aircraft hide while the clock is away from live, because there is no record of where they were. Go further back with Time travel: earthquakes, storms, natural events and satellites then switch to their archives. The clock carries over into the Solar System view and back.
The layers panel
The Layers button (top right) opens the dock of switches listed in Globe layers, plus:
- Base map: Satellite imagery (Esri World Imagery) or Dark map (Esri dark grey canvas). Far out, NASA's Blue Marble and, on the night side, Black Marble city lights are drawn over it.
- Graphics: Auto, High, Balanced or Low. Auto starts from your device and steps down if frames get slow. Lower levels draw fewer aircraft and satellite models and coarser tiles.
- Battery saver: fewer frames (5 to 15 a second) while nothing moves; full speed returns on any touch, key or motion.
- Under the hood (also the ` key): frame rate and times, draw calls, the GPU, every data source and how old its data is, and the satellite worker's timing.
Your layer choices are remembered in this browser.
Places, panels and tools
The band at the bottom of the globe (the Explore sheet on phones) holds every destination and tool. On the left it shows the camera's height and what that height is called.
| Button | What it does |
|---|---|
Earth now | What is happening on the planet right now, in one panel: earthquakes, tropical cyclones, aurora, launches, people in space, asteroid flybys, wildfires and the weather extremes. E opens it. See Earth now. |
⌕ Search | Search satellites (by name, NORAD number or everyday name such as ISS, Hubble, Tiangong), countries, flight numbers, aircraft by type or kind ("A380", "helicopters"), airports by code, name or city, places by name (Photon, OpenStreetMap), the views in this band, and volcanoes, big employers and lighthouses once their layers have loaded. / opens it. |
Street | Flies to London at about 3.5 km, tilted, to show street-level detail. |
Airspace | Europe from 1,400 km: the air traffic picture. |
Earth | The whole planet, looking at the sunlit side. |
GEO belt | Far enough out (160,000 km) to see the ring of geostationary satellites 36,000 km up. |
Moon | Flies out to the Moon at its real position and looks at it. |
Near misses | Upcoming close approaches between objects in orbit (CelesTrak SOCRATES, under 5 km in the next week). Pick one to watch both objects at the moment of closest approach. |
Falling soon | Satellites and debris predicted to re-enter the atmosphere in the next 30 days, soonest first, each with its window in plain words and its re-entry corridor. Worked out in your browser from the same element sets. See Falling soon. |
Tonight | What you can see in your sky tonight. See Tonight and look up. |
Look up | Your sky right now, from where you stand: point your phone up. See Tonight and look up. |
Find flight | Type a ticket number (BA 123 becomes BAW123), a callsign, a registration or a hex address and follow that plane. The website searches the aircraft it already has and otherwise opens adsb.lol's own map; the download version asks adsb.lol directly and refreshes every 15 seconds. |
▶ Tour | A guided 80-second flight through what the globe can do. Any click, scroll or Esc stops it. |
Launches | Every upcoming rocket launch (Launch Library 2): countdowns, how sure the time is, webcasts, calendar and notification reminders, fly to the pad, and a reconstructed ascent replay (an estimate, labelled as one). |
Flybys | Asteroids and comets passing Earth in the next 60 days (NASA/JPL CNEOS), with distance in lunar distances and a rough size. |
Directions | A route by car, on foot or by bike between two places (FOSSGIS OSRM, OpenStreetMap), turn by turn, then "fly it" along the route. |
Weather | Weather mode: one timeline from the last couple of hours into the next five days. See Weather timeline. |
Before/after | Recent Landsat and Sentinel-2 pictures of the place in view (NASA HLS, VIIRS daily), the newest fairly clear one against an older one, split by a slider. |
Measure | Draw pins, lines, areas and distance arrows; outline a country. M opens it. See Draw and measure. |
Time travel | Go back to any moment: a slider over the last 30 days, a date box, steps back, and famous moments (the 2011 Tōhoku earthquake, Hurricane Ian's landfall, Apollo 11). Earthquakes, storms, natural events and satellites show what was there then. See Time travel. |
Eclipses | The solar eclipses of 2027 to 2030: watch the Moon's shadow cross the Earth, with the path of totality and how much of the Sun is covered where you are. |
Solar system ↗ | Keeps zooming out: the camera climbs until the Solar System view takes over, with Earth in the same place on screen. |
Two more panels open from search, voice or a link rather than the band: People in space (who is aboard the ISS and Tiangong now, from Launch Library 2) and the camera Director (in the Ops rail, see Ops looks).
Globe layers
Every switch in the globe's Layers panel, what it shows and where the data comes from. "On" is how a fresh visit starts; some layers start off on phones to save battery and memory. The id in the first column is the name share links use (see Share and embed).
| Layer | What it shows | Source | Starts |
|---|---|---|---|
| Space | |||
stations | Space stations: the ISS, Tiangong and other crewed or station objects. The nearest satellites get 3D models. | CelesTrak element sets (the website's copy, refreshed every 6 hours), positions by SGP4 in your browser | on |
visual | Bright satellites, the ones you can see with the naked eye. | CelesTrak | on |
gnss | Navigation satellites: GPS, Galileo, GLONASS, BeiDou. | CelesTrak | on |
geo | The geostationary belt. | CelesTrak | on |
weather | Weather satellites. | CelesTrak | on |
starlink | Starlink, including fresh launches still flying in a train. | CelesTrak | on |
active | Every other active satellite CelesTrak lists. | CelesTrak | on (off on phones) |
debris | The debris clouds of the 2007 Fengyun-1C anti-satellite test and the 2009 Iridium 33 / Cosmos 2251 collision. The full catalogue with every rocket body and fragment is Space-Track's and may not be redistributed. | CelesTrak | on (off on phones) |
launches | The next 40 rocket launches as markers on their pads, with countdowns. Pads at one site share one label. | Launch Library 2 (The Space Devs), copied by the site build every 6 hours | on |
reentry | Re-entry corridors: the ground track of every object predicted to come down in the next 30 days, around its likeliest time. See Falling soon. | Predicted here from CelesTrak element sets | off |
| Air | |||
air | Civil aircraft, dead-reckoned between reports so they keep moving; the nearest ones become 3D models that bank and climb. | OpenSky Network snapshot every 15 minutes (download version: the website can't reach it, see Download version) | on |
mil | Military aircraft. | adsb.lol every 60 seconds (download version) | on |
airq | Air quality on a grid over the view: the US AQI colour, PM2.5, PM10, ozone, nitrogen dioxide. A forecast model's value for the current hour (about 11 km over Europe, 45 km elsewhere), not a sensor's; the card says so. | Copernicus CAMS via Open-Meteo (OpenAQ's stations need a key since its v3) | off |
smoke | Smoke and dust seen from space: the UV aerosol index of the current UTC day's orbits so far (places not yet passed over are empty), with a legend. Click the sea to read the value. | NASA Suomi NPP OMPS via NASA GIBS | off |
airports | The world's large and medium airports, with codes close up. Click one for its board: the planes arriving, departing and on the ground right now (see Planes and airports). | OurAirports (public domain); boards from the live aircraft on the globe | on (off on phones) |
| Earth | |||
quakes | Earthquakes of magnitude 2.5 and up in the last 24 hours (with the clock in the past: the 24 hours before the time shown). | USGS real-time feed; the USGS catalogue for the past | on |
transit | Live buses, trams and trains in Boston, Helsinki, Norway, Austin and Minneapolis-St Paul, moving smoothly between real reports. | MBTA, HSL, Entur, CapMetro, Metro Transit | off |
buoys | About 870 ocean buoys and coastal stations with their latest report: wave height and period, wind and gusts, water and air temperature, pressure. Coloured by wave height (grey: no wave sensor). | NOAA NDBC, refreshed every 10 minutes (the website goes through its relay) | off |
dart | The DART tsunami buoys on the deep-sea floor. A card reads the buoy's own file: the water column above the sensor, the last reading, and whether it is in event mode (fast sampling after a quake, a tsunami or a test). Warnings come from tsunami.gov, not from here. | NOAA NDBC | off |
tides | About 300 US tide and lake gauges. A card reads the water level now (every 6 minutes, preliminary until checked) and the next high and low tide (NOAA's predictions). | NOAA CO-OPS (Tides & Currents) | off |
sst | Sea-surface temperature, daily and gap-free, with a legend; click the sea to read the value (to about 0.1 °C). It is yesterday's pre-dawn temperature: buoys read a little warmer in the afternoon. | NASA JPL GHRSST MUR via NASA GIBS | off |
ships | Ships in the northern Baltic from live AIS: arrows far out, true-size hulls with wakes close in. | Fintraffic Digitraffic | off |
bikes | Bike-share stations and free bikes in about 800 systems worldwide, near the view. Systems whose feeds stopped are greyed. | CityBikes | off |
traffic | Simulated cars on real roads, with traffic lights and rush hours by local time. In New York and Finland measured speeds (and counts) drive the cars and colour the roads. The cars themselves are a simulation and say so. | Roads from OpenFreeMap vector tiles; speeds from NYC DOT and Fintraffic | off |
storms | Tropical cyclones: tracks, forecast cones, coastal watches and warnings, wind fields. In the past: the storms going on then, where they were, with their tracks until then. | NOAA NHC (Atlantic and East/Central Pacific), GDACS (every other basin), NASA EONET | on |
events | Natural events: volcanic eruptions, wildfires, floods, sea and lake ice, dust and more, open in the last 20 days; in the past, the ones going on at the time shown (closed ones too). | NASA EONET | off |
fires | Wildfire hot spots seen by satellite in the last 24 hours, worldwide, and current US fire perimeters. | NASA VIIRS thermal anomalies (via GIBS), NIFC | off |
radio | About 3,000 radio stations (1,500 on phones) at their cities, with an analog tuner whose dial snaps to real stations and flies to them. | radio-browser.info | off |
lighthouses | Lighthouses of the world, with their light characteristics. | OpenStreetMap | on (off on phones) |
sun | The point where the Sun is overhead, its meridian, and 24 time-zone meridians. | Computed | off |
terrain | 3D terrain: mountains and valleys. Cars, buses, planes on the ground and drawings stand on it. | Re:Earth terrain (Mapterhorn), no key | on (off on phones) |
buildings | 3D buildings close up (below about 3 km), with their mapped heights and colours, standing on the terrain. | OpenStreetMap via OpenFreeMap's vector tiles (the Overpass API if those can't be reached) | off |
cams | Live traffic cameras and video from 12 networks in the US, Canada, Europe and Asia. A camera's picture can be projected into the 3D city from its estimated position; "Look through" lets you line it up and save. | TfL, NYC DOT, Caltrans, Fintraffic, DelDOT, Iowa DOT, MoDOT, Statens vegvesen, DriveBC, City of Calgary, Hong Kong, Singapore LTA | off |
cctv | Cameras and plate readers that volunteers have mapped in OpenStreetMap, with view wedges, close up. | OpenStreetMap via the Overpass API | off |
alpr | Every licence-plate reader volunteers have mapped in the US and Canada: a dot cloud from far away, and close up each reader with its make, operator and which way it faces. Locations and tags only: no images, no plates. Directions in the US or Canada count the readers along the route. | OpenStreetMap via DeFlock / FlockHopper's hourly tiles | off |
milareas | Land mapped as military (bases, ranges, depots), outlined below about 400 km, named after the military airfields inside or the nearest town; its card asks OpenStreetMap for its real name. | OpenStreetMap via OpenFreeMap's vector tiles | off |
photoreal | Photoreal 3D cities. Needs your own free Cesium ion token, kept in your browser; while on, place search uses Google's geocoder. | Google Photorealistic 3D Tiles through Cesium ion | off |
volcanoes | Volcanoes of the world: type and height (not whether they are erupting). | Wikidata | on (off on phones) |
companies | Big employers (20,000+ staff) as towers at their headquarters. | Wikidata | on (off on phones) |
lightpollution | How bright the night sky is, coloured by Bortle class (clear where it is dark; blue, green, yellow, orange, red, then pink and white over city centres). A modelled clear, moonless night in 2014-15, drawn in your browser from a 1.7 MB grid. | Falchi et al. 2016, World Atlas of Artificial Night Sky Brightness (CC BY-NC 4.0, non-commercial) | off |
aurora | The aurora forecast: the chance of seeing it, refreshed every 10 minutes. | NOAA SWPC OVATION | on (off on phones) |
clouds | A cloud layer 9 km up with cloud shadows. | NASA Blue Marble | on |
night | City lights on the night side. | NASA Black Marble (VIIRS) | on |
labels | Place names when close. | Esri | on |
Every source, its licence, how fresh it is and how accurate, is written down in docs/DATA_SOURCES.md. Counts next to each switch show how many objects a layer holds right now.
Cards, following and the cockpit
- Satellites: what the satellite is in one sentence, its orbit, height and speed, whether it is in sunlight, and When can I see it? (its passes over you in the next 3 days). Space stations say how many people are aboard.
- Aircraft: what it is, what it is doing and where it is going (see Planes and airports), and Share (a link that finds that flight wherever it is when opened).
- A country: click the ground and its border lights up, with facts (Wikidata, World Bank), what the globe knows about it right now (earthquakes, lighthouses, big employers, the wind) and English-language headlines from its news outlets (GDELT).
- Everything else (quakes, storms, fires, ships, buses, cameras, stations, volcanoes, launches, drawings) opens its own card.
How we judge this: where each live item came from
Every live card (aircraft, ships, satellites, quakes, storms, fires, events, transit, cameras, bikes, buoys, tides, air quality and the rest, on the globe and on the 2D map) ends with a line saying which sources reported it, how many of them agree, how old the data is and a confidence word. A contact on the map is a claim by its sources, not proof: two networks placing the same aircraft in the same place, or NOAA and GDACS placing the same storm, count as agreement; a feed that only repeats another agency's data (EONET passing on an NHC advisory) is named as such and not counted twice. Hover the confidence word for the rule:
Confirmed: two or more independent sources agree and their data is fresh. Reported: one fresh source. Stale: the newest data is older than this layer expects. Unknown: no source said when its data was made. Age is the age of the data, not of the download.
"(copy)" after a source means it reached us through a copy: the website's own mirror (satellite element sets, launches), the public relay, or a stored snapshot. Its age is still the age of the data itself. Each layer has its own idea of fresh: two minutes for an aircraft position, fifteen for a ship, nine hours for a storm advisory, three days for a satellite's elements. Time travel shows past records, which are never called stale.
Export what's in view: the 2D map's layer list and the globe's Layers dock save the live items in view as
GeoJSON, CSV or KML, each with these provenance columns. Nothing leaves your browser. The MCP server's answers carry
the same line as a provenance field.
Follow
Double-click a satellite or aircraft (or press Follow in 3D on its card) and the camera rides along with it while you orbit around it. Esc lets go.
Cockpit
While following, press C (or CKPT in the Ops rail) to ride the satellite (or, in the download version, the plane) looking along its path. Drag to look around, the wheel or a pinch zooms the lens, the arrow keys turn your head, Esc gets out. The model and its orbit line hide while you are inside.
Planes and airports
Live aircraft need the download version: the ADS-B networks refuse websites. There, military aircraft refresh every 60 seconds and a plane you watch every 10 seconds; everything in this section works with the planes the globe has.
The aircraft card
- What it is: its class (airliner, heavy, prop, turboprop, helicopter, fighter: the 3D model follows it), maker and type, registration, owner, the country its address belongs to, and a photo, from adsbdb (asked only for the plane you look at; answers kept in your browser for a day).
- What it is doing: its flight phase in a pilot's words (taxiing, take-off, climbing, cruise, descending, approach, final, landing roll) and its height above the nearest field; "On final for 34R" when it is lined up with a runway.
- Where it is going: the route its callsign usually flies, shown only when it fits where the plane actually is, as a dashed arc to the destination; the airports at either end open their boards.
- Its trail: where it has been in the last half hour, coloured by altitude, for the plane you follow or open. Pin keeps a trail drawn after the card closes; Copy GeoJSON takes it with times and altitudes. Trails start when a plane is first heard here.
- Tell me when it lands: a notification when it is on final and when it touches down (keep the tab open).
- From the tower: watch it from the airport's tower with a lens that keeps it framed; Esc or Leave the tower gives the camera back.
Airport boards
Click an airport (the airports layer) for its board: the planes arriving (low and descending towards it), departing (climbing away), on the ground, and those that just landed or took off, worked out from the live aircraft around it, with emergency squawks standing out. It is not a timetable: a plane counts once it is close and low enough to tell. The card also has the weather at the field with its VFR or IFR category, the runway in use and the wind on each runway, Follow the next arrival and From the tower.
Arrival times are estimates with a range, such as ≈ 12 min (9–17): worked out from how far the plane is, how fast it is going and how fast it is coming down. The range is narrow once it is lined up with a runway and wide when it is far out or still has to turn round, because approaches add holds and vectors no feed can see. Departures say about how long ago they took off.
In the download version the card also shows:
- The airport's METAR and TAF (from the Aviation Weather Center) in plain words: wind, visibility, weather, cloud, temperature and pressure now, and the forecast period by period with its flight category, plus the reports exactly as sent. Airport dots in view are coloured by flight category: green VFR, blue MVFR, red IFR, magenta LIFR. The website shows the model weather instead, because aviationweather.gov does not answer websites.
- Runways used, last hour: while the card is open (or after Keep watching, up to three airports), planes near the field are asked for a fresh position every 15 seconds, and each landing and take-off is matched to its runway. The card counts them per runway and says when the airport changed direction. Each landing also scores the arrival estimates made for it, and the card says how they have been doing at that airport.
Cockpit weather
Riding a plane in the cockpit (or with the HUD on while following one), the HUD shows its flight phase and the weather where it is: the wind at its height and whether it is a head or tail wind, the outside temperature against the standard atmosphere, true airspeed and Mach, cloud at its level, an icing hint, and the nearest airport and destination. From Open-Meteo, asked only when the plane moves to another cell or level.
Earth now
Earth now in the band, the E key or a globe.html#go=now link opens a panel that sums up what is happening right now, from the same feeds the globe draws. Every line is a button: it switches the right layer on and flies there (and opens the card where there is one). On a desktop the panel sits on the left, where the layer list steps aside for it; on a phone it is a sheet above the bottom bar that folds down to its title while the camera flies (tap the title to unfold it).
| Section | What it shows | From |
|---|---|---|
| Earthquakes | How many M2.5+ quakes in the last 24 hours, how many were M6 or more, the strongest, the busiest regions (tap one to fly to its strongest quake), and a chart of quakes per day: the last 7 days at M2.5+ or the last 30 at M4.5+. Today's bar is faint: the day isn't over. | USGS real-time feeds |
| Tropical cyclones | Every active storm, strongest first, with its wind in knots, pressure and movement where NOAA gives them. | NOAA NHC, GDACS, NASA EONET |
| Aurora | The planetary K index now, in words (quiet, unsettled, active, or a G1 to G5 storm), how far from the poles the aurora may reach, and a chart of the last 3 days and the next day's forecast (faint) with the G1 storm line. The line flies to the night side of the Arctic with the aurora layer on. | NOAA SWPC |
| Launches | Launches in the next 24 hours with live countdowns, the full list, and how many launches are listed per month. The list holds only the next few dozen launches, so the current month (launches already flown are gone from it) and months past the end of the list are faint. | Launch Library 2 (the website's copy) |
| People in space | How many people are in orbit and on which station; tap a station to fly to it. | Launch Library 2 |
| Near-Earth flybys | How many asteroids pass within 20 lunar distances this week and the closest one. | NASA/JPL CNEOS |
| Wildfires | Named wildfires that are still open, with prescribed burns counted apart, the largest reported and where most of them are. These are incident reports, mostly from the US and Canada, not every fire on Earth: the Wildfires layer adds what the satellites see. | NASA EONET |
| Weather extremes | The hottest and coldest air (2 m) and the strongest wind (10 m) anywhere on Earth at the model hour nearest now, with the country under it. A tap opens weather mode with that layer on and flies there. These are model grid cells, open sea and Antarctica included, not weather-station records. On a phone this section waits for a tap (it downloads about 1 MB). | NOAA GFS |
The charts are drawn in the page: hover a bar (or tap it) for its value; screen readers hear every value. The panel refreshes every five minutes while it is open, and ↻ refreshes it now. Nothing is downloaded while it is closed.
Falling soon
Falling soon in the band (or a globe.html#go=reentry link) lists the objects predicted to come back
into the atmosphere in the next 30 days: old Starlinks, spent satellites, debris. Each says when, as a window
("between Tue 03:00 and Thu 21:00 UTC") rather than a moment, and where, as a corridor: the stretch of its ground track
it could come down on. The reentry layer draws every corridor at once. Nothing is downloaded for this: the
globe works it out from the element sets it already has, in about a tenth of a second.
How it is worked out
Each element set says how fast the object's orbit is shrinking (the change in its mean motion, n-dot) and how much drag it feels (B*). From those and a model of the upper atmosphere, the globe flies the object down, step by step, until its lowest point is 100 km up: below that it is minutes from the end. The atmosphere is thicker when the Sun is active, so the model is scaled by the Sun's radio flux (F10.7; 140 is assumed for late 2026). Checked against real re-entries: Tiangong-1 (2 April 2018) and GOCE (11 November 2013) fall inside the windows their last element sets give.
Why the windows are so wide
Re-entry predictions are uncertain by nature, even at the space agencies. The window is ±25% of the time the object has left, the usual rule of thumb for objects coming down without control (re-entry analysts quote 10-25%; we take the wide end):
- The air up there changes. At 200-400 km it is so thin that one solar flare or geomagnetic storm can double its density within a day, and nobody can forecast the Sun weeks ahead.
- We don't know how the object flies. A tumbling panel has several times the drag of the same panel edge-on.
- The elements are a few hours old and are themselves a fit to radar tracking. Every new set (every few hours) moves the window, and it narrows as the day comes closer: weeks ahead it spans days, the last day it spans hours.
- Where follows from when. An object circles the Earth every 90 minutes, so an hour's doubt in time is 40,000 km along its track. Until the window is a few orbits long, it can come down anywhere between the latitudes its orbit reaches; the tracks drawn are the orbits around the likeliest time.
Satellites that still have fuel are a different case: an operator can keep one up, or bring it down on purpose over an empty ocean, and then the prediction does not apply. Their cards say so. Objects whose orbit is clearly being pushed (shrinking faster than drag could manage, or growing) are left off the list. The card's provenance line uses the element set's epoch as its data time and calls a prediction stale once its elements are older than a fifth of the time it had left. Most of what re-enters burns up; for authoritative warnings, follow your space agency.
Tonight and look up
Tonight above you
The Tonight button (or tonight.html, or globe.html#go=tonight) asks for your location once and then says, in plain words:
- Visible passes of the ISS, Tiangong and Hubble, Starlink trains still low after launch, and the brightest satellites, each marked clear or cloudy from the cloud forecast (Open-Meteo, location rounded to about 10 km).
- The five bright planets, the Moon's phase, moonrise and moonset, sunset, darkness and sunrise, the next full Moon by its name (and whether it is a supermoon).
- Your sky: how dark it is where you are (the Bortle class and a Sky Quality Meter reading from the Falchi et al. 2016 light pollution atlas, CC BY-NC), whether the Milky Way shows and about how many stars, the nearest darker sky (Bortle 3) and which way, and one line on how good tonight is from the sky, the Moon and the clouds.
- Deep sky tonight: galaxies, star clusters and nebulae (Messier, NGC and IC from OpenNGC, CC-BY-SA-4.0) well placed while it is dark, for your eyes, binoculars or a small telescope under your sky, each with when it is highest and which way to look. On the globe, Find it points you at one in look-up mode.
- Meteor showers with an honest rate from where you are, the chance of aurora where you stand, the next solar eclipse you can see from home, meetings of the Moon and planets in the next 30 days, launches within 1,000 km in the next week, and the spacecraft farthest from home.
- Calendar downloads an .ics file with a 10-minute reminder that works with the site closed; Remind me shows a notification while the page is open. Share tonight sends a one-line summary with a link.
Sections fold and stay folded. Your location is saved on your device only, rounded.
Look up
Your sky from where you stand. On a phone, hold it up and the view follows the phone's motion sensors; on a computer, drag. It shows planets, bright stars, constellation figures (Figures), satellites and aircraft overhead, a compass ring and the next ISS pass. Things on the ground are hidden so they don't streak across the sky.
- Find: pick a planet, the Moon, the ISS or a bright star, and an arrow leads you to it ("turn right 32°, up 11°").
- Tap anything in the sky to learn what it is: distance, light travel time, "the light reaching your eyes left Vega in 2001".
- Sky on: any date from 1800 to 2049 (planets, Moon and stars; satellites only within 3 days of today). Now returns to the present.
- Red: a red-light view that keeps your eyes used to the dark (remembered). Done or Esc leaves.
The weather timeline
Weather in the band opens one timeline that runs from what satellites and radar saw in the last couple of hours into what a weather model forecasts for the next five days (three on phones). Nothing is downloaded until you open it.
Pick the forecast model in the panel: NOAA GFS (1° grid, the default) or ECMWF IFS (0.25°, ECMWF's open data, CC BY 4.0), or compare the two side by side with a slider between them. Both are read straight from their public files in your browser, a few fields at a time. A legend says what the colours mean, and pointing at the globe reads every field at that spot.
| Switch | Shows | Source |
|---|---|---|
Clouds ir | Infrared cloud images every 10 minutes, cold cloud tops in colour. Covers the Americas, the Pacific and Asia-Australia; Europe, Africa and the Indian Ocean need Meteosat, which no free tile service carries. In the forecast part, the model's cloud cover takes over. | NASA GIBS: NOAA GOES-East and GOES-West, JMA Himawari |
Rain radar | Weather radar where national radars exist. In the forecast, the model's rain rate. | RainViewer |
Rain from space rain | Global rain between 60° north and south, about 7 hours old (a still). | NASA IMERG |
Lightning lightning | Strike density in the last 15 minutes, the Americas and the Pacific (a still). | NOAA nowCOAST |
Wind wind | Animated wind at 10 m along the whole timeline. | the chosen model (GFS or ECMWF) |
Temperature temp | Temperature at 2 m along the whole timeline. | the chosen model |
Pressure pres | Isobars with the highs and lows marked H and L. | the chosen model |
Gusts gust | Wind gusts. | the chosen model |
Waves wave | Ocean wave height and direction (nothing over land). | NOAA WAVEWATCH III with GFS; ECMWF's wave model with ECMWF |
Clouds, rain and lightning start on. Drag the slider, or press play: the globe's clock moves with it, so the day-night line and the satellites move with the weather, and moving the clock in the time bar moves the slider. Closing weather mode puts the clock back to live.
Time travel
Time travel in the band (on phones: Time in the dock) opens a panel on the globe's one clock. Drag the slider (the last 30 days; around the day shown when you go further back), type a date and time (UTC), step an hour or a day, or jump 1 day, 1 week, 30 days or 1 year back. The clock stops at the moment you pick; press ▶ or a speed in the time bar to let it run from there, and Now to come back.
On this day in history takes you to a moment, switches on the layers that tell its story and flies there: the Tōhoku earthquake and tsunami (2011), Hurricane Ian's landfall in Florida (2022), Typhoon Haiyan (2013), the Türkiye–Syria earthquakes (2023), the James Webb Space Telescope's launch (2021) and Apollo 11 (1969).
What has history, and what doesn't (the panel says the same, and what came back for the time shown):
- Earthquakes: the USGS catalogue, back to 1900. The 24 hours before the time shown, magnitude 2.5 and up (at most 1,500 a day, the biggest first); each appears as the clock passes it.
- Tropical cyclones: NASA EONET's past storms and GDACS's past cyclones, roughly since 2000: where each storm was at the time shown and its track until then. Forecast cones and warnings of the time are not archived, so none are drawn.
- Natural events (the
eventslayer): EONET's events going on that day, including ones closed since. - Satellites: the website keeps a copy of the element sets every day for 30 days (space stations, bright, navigation, weather, geostationary, science and the debris clouds). Each satellite uses the set nearest the time shown; one with nothing within 7 days is hidden rather than drawn in the wrong place. Starlink, OneWeb and "all other active" use today's sets within a week of today and hide further back.
- Live only: aircraft and upcoming rocket launches (hidden in the past), cameras, ships, transit, bikes, traffic, weather, aurora, the ocean and air-quality layers and the VIIRS fire hot spots (they keep showing now).
Copy link in the panel copies the view with its time (t=) and the panel open (go=history).
Draw and measure
Measure in the band, M, or your voice. Pick a tool and click (or tap) on the globe:
- Line: each leg and the total length. On 3D terrain, finished lines up to 30 km also get the length over the hills and the climb and descent.
- Area: the area and perimeter of the shape you draw.
- Distance: an arrow from one place to another, with the bearing, and optionally the trip by road (OSRM).
- Pin: a named marker.
- Outline a country: its border and its area.
Distances are measured on the real shape of the Earth (the WGS84 ellipsoid, within a millimetre of the reference library GeographicLib) and areas on it too. Up to 512 points. A quick second click on the last point, Enter or Finish ends a shape; Backspace, Delete or Ctrl+Z undoes the last point; Clear removes the drawing; Copy GeoJSON takes it to other mapping software. Share links carry the drawing (see Share and embed).
On phones, while a tool is armed the card shrinks to a slim strip above the dock with the running total, Undo, Finish and a chevron for the rest.
Ops looks
The OPS rail on the globe holds camera looks and tactical overlays. Off costs nothing; they run in your browser with no key.
| Button | Key | What it does |
|---|---|---|
EO normal | 1 | Normal colour. |
NVG nvg | 2 | Night vision. |
WHT flir | 3 | Thermal, white hot. |
BHT flirbh | 4 | Thermal, black hot. |
IRN iron | 5 | Thermal, ironbow colours. |
CRT crt | 6 | An old monitor, with scan lines. |
NOIR noir | 7 | Black and white. |
HUD | H | Tactical HUD: compass tape, reticle, the ground under it in latitude/longitude and MGRS, altitude, ground sample distance, UTC, and a lock line with range to the followed object. |
DET | D | Detection: boxes and IDs on the nearest things in view (46, or 22 on phones): satellites, aircraft, quakes, storms, cameras, buses, ships. |
CKPT | C | Cockpit: ride the object you follow (see Cards). |
DIR | Director: frame a view and Add it as a shot (the look comes along), set how long the flight to it takes, then Play. Cinema hides every control for a clean screen recording. Scenes travel as a link or a .json file. | |
| mic | V | Voice: see Voice commands. |
The thermal looks are a style, not real infrared: they map brightness and edges, not temperature.
Voice commands
Press the mic in the Ops rail or V, or hold Space, speak, and let go. It uses your browser's own speech recognition (Chrome, Edge and Safari; not Firefox) and turns the sentence into one action without any AI service. It answers out loud and with a short sound. You can start with "Hey Overwatch" or "Computer", and "please" is fine. Say "help" for a list.
Ideas to try
- Take me to Tokyo
- Track the ISS
- Night vision
- Thermal
- Enter cockpit
- Turn on earthquakes
- Walking route from Big Ben to the Tower of London
- How many satellites are in view?
- What's this?
- Show me the launches
- Zoom out to a globe view
- What's the weather in Paris?
- How many planes over Texas?
- Measure from Paris to Berlin
- Outline France
- How big is Brazil?
- Draw an area
- Clear the drawing
- Arrivals at Heathrow
- What's taking off from JFK?
- What plane is that?
- METAR at Denver
- Which runway is Heathrow using?
Everything it understands
| Kind | Say, for example |
|---|---|
| Go somewhere | "take me to Tokyo", "fly to Mount Everest", "show me the ISS", "where is Hubble", "zoom in", "zoom out", "back up" |
| Follow | "track the ISS", "follow Hubble", "lock on to the space station"; "stop", "stop tracking", "let go" |
| Views and panels | "what's above me tonight", "look up", "show the launches", "open the solar system", "play the tour", "near misses", "eclipses", "asteroids", "who is in space", "the Moon", "geostationary" |
| Layers | "turn on earthquakes", "switch off Starlink", "hide the satellites" |
| Camera | "reset", "whole Earth", "north up", "top down", "bird's eye" |
| Time | "pause", "speed up", "fast forward", "go live", "back to now" |
| Looks | "night vision", "thermal", "black hot", "ironbow", "CRT", "old TV", "noir", "black and white", "normal"; "HUD on", "detection off", "enter cockpit", "exit cockpit" |
| Questions | "what's this?" (what the pointer rests on), "where am I", "how many satellites are in view", "how many ships near Helsinki", "how many planes over Texas" |
| Answers in a list | "the second one", "number three": picks from what the last answer listed |
| Weather | "what's the weather here", "is it raining in London", "how cold is it in Oslo", "temperature in Rome" |
| Routes | "route from Paris to Lyon", "walk from Big Ben to the Tower of London", "how do I cycle from A to B", then "fly the route" |
| Measure | "measure from Paris to Berlin", "driving distance from Boston to New York", "how far is Tokyo", "how far is the Moon", "how far is the ISS" |
| Draw | "draw an area", "draw a line", "measure a distance", "drop a pin", "drop a pin on Rome", "finish", "undo", "clear the drawing", "how long is it", "stop drawing" |
| Aviation | "arrivals at Heathrow", "what's taking off from JFK", "departures from Denver", "what plane is that", "where is that plane going", "show the trails", "hide the trails" |
| Outlines | "outline France", "show the border of Japan", "how big is Brazil" |
Spoken weather answers give the temperature, the sky and the wind, and when they matter the gusts, the pressure and whether it is rising or falling, and over water the sea state and waves. They use Celsius and kilometres an hour, or Fahrenheit and miles an hour when your browser's language uses them (US English, for example). Place names are looked up with Photon (OpenStreetMap). With weather mode open, the forecast at the moment shown answers weather questions; otherwise Open-Meteo is asked about that one place.
Keyboard shortcuts
Keys do nothing while you type in a text box. Shortcuts with letters are case-insensitive.
3D globe
| / | Search |
| E | Earth now: open or close |
| + − | Zoom in, out |
| N | North up and level |
| T | Look straight down |
| R | Reset: the whole Earth |
| P | Share a picture of the view |
| M | Open or close Measure |
| Enter | Finish the shape (Measure) |
| Backspace Ctrl+Z | Undo the last point (Measure) |
| 1–7 | Sensor looks |
| H D C | HUD, detection, cockpit |
| arrow keys | Turn your head in the cockpit |
| V, hold Space | Voice |
| ` | Under the hood |
| Esc | Leave the cockpit or the tower, stop following, close the card, leave look up, stop a tour or a flight |
| with the globe focused | Arrow keys turn it, + − zoom, Page Up Page Down tilt, Enter opens what is in the middle |
| toolbars | Arrow keys, Home and End move along the band, the time bar and the layer dock |
2D map
| / | Search |
| 1–5 | Presets: Around me, Military air picture, Space, Storms & quakes, Everything |
| L | Show or hide the layers rail |
| P | Pause |
| I | Follow the ISS |
| M | Surprise me: a random notable military aircraft |
| S | Sound effects on or off |
| A | Music on or off |
| N | Next music set |
| R | Draw and measure on or off |
| Esc | Close the detail panel |
Solar System
| Esc | Stop riding along with the focused body |
| ` | Under the hood |
| ↑ ↓ Enter | Choose a search result |
The 2D map
open-overwatch.html is a flat situation map. The rail on the left holds the layers in groups; each layer has a description, a live count and status, and some have options (which satellite groups, which aircraft network, which camera cities). The tabs on the right are Brief (what is notable now), Log (each feed's errors as they happen) and Setup (the helper, optional keys, a test of every feed). On first visit you choose to enter with audio or silent: the map can play a soundtrack generated in the browser, or radio stations.
The 2D map has draw and measure too (the ruler button or R; the same tools and accuracy as the globe, with lines drawn as the real shortest paths), Share (a link with the view, its layers and the drawing, in the globe's format, so a link made on one view opens the same area on the other) and 3D globe, which opens the globe where the map is.
| Layer | What it shows | Starts |
|---|---|---|
| Air (the aircraft feeds need the download version's helper) | ||
air_local | All aircraft in view (ADS-B from adsb.lol, adsb.fi, or airplanes.live with their permission), swept across the visible area. | on |
air_mil | Military aircraft, worldwide. | on |
air_emg | Emergency squawks worldwide: 7700 emergency, 7600 radio failure, 7500 unlawful interference. | on |
air_opensky | A global civil snapshot from OpenSky every 15 minutes. | off |
airports | The world's large and medium airports (OurAirports), with codes as you zoom in and runways from zoom 11. Click one (or search "LHR", "Heathrow", "Denver") for its board, made from the aircraft on the map: arriving, departing, just landed or took off, on the ground; the weather at the field with a VFR/IFR category, the runway in use and the wind along and across every runway. The aircraft card says what a plane is (adsbdb: type, registration, owner), what it is doing ("On final for 13L") and the route its callsign flies, flagged when the plane is not on it; the weather at its height (wind and what it does to the plane, the temperature against the standard atmosphere, true airspeed and Mach); and its trail coloured by altitude, which you can pin or copy as GeoJSON. | off |
| Space | ||
sats | Satellites from CelesTrak element sets, propagated live with SGP4; pick groups, and an automatic ground track and footprint for the selected one. | on |
reentry | Objects predicted to re-enter in the next 30 days: a dot where each is at its likeliest time and its likeliest orbit as a line; the card gives the window in plain words. See Falling soon. | off |
| Sea & sky | ||
lightpollution | How bright the night sky is, by Bortle class, clear where it is dark (Falchi et al. 2016 atlas, CC BY-NC 4.0, non-commercial; drawn in your browser). | off |
ships_fi | Ships around Finland (Fintraffic Digitraffic AIS); zoom in past level 5 for individual ships. | off |
ships_ws | Global ships from aisstream.io (needs a free key). | off |
buoys | NOAA NDBC ocean buoys and coastal stations: waves, wind, water temperature (the helper or the website's relay). | off |
dart | NOAA DART tsunami buoys; tap one for its water column and event mode. | off |
tides | NOAA CO-OPS tide gauges (US): the level now and the next high and low. | off |
sst | Sea-surface temperature (NASA GHRSST MUR, daily). | off |
smoke | Smoke and dust: the OMPS UV aerosol index of the day's orbits so far. | off |
airq | Air quality on a grid over the view, from the CAMS model via Open-Meteo (a model, not a sensor). | off |
balloons | Weather balloons from SondeHub: community-uploaded and unverified, so it asks first and shows a warning. | off |
| Ground | ||
quakes | Earthquakes (USGS). | on |
events | Natural events: wildfires, storms, volcanoes, floods, ice (NASA EONET). | off |
gdacs | Disaster alerts from GDACS (EU/UN), the last 14 days. | off |
news | World news from GDELT: the last 24 hours matching your query, placed by the reporting country. | off |
cams | Official traffic cameras from zoom 8 in London, New York, California, Delaware, Iowa, Missouri, British Columbia, Calgary, Finland, Norway, Hong Kong and Singapore, with live video where the agency streams it; a Windy key adds webcams worldwide. | on |
hotspots | Wildfire hot spots of the last 24 hours, keyless (NASA VIIRS via GIBS), from zoom 4. A hot pixel is not always a wildfire: farm burning and gas flares show too. | off |
fireperims | Current US wildfire perimeters (NIFC), coloured by containment. | off |
alpr | Licence-plate readers mapped in the US and Canada (OpenStreetMap via DeFlock / FlockHopper): a dot cloud below zoom 10, every reader with its tags from 10. | off |
fires | Active fires from NASA FIRMS (needs a free MAP_KEY). | off |
| Cities | ||
bikes | Bike share: about 800 systems worldwide (CityBikes), stations with free bikes and docks, from zoom 11. | off |
transit | Live buses, trams, metros, trains and ferries in Boston, Helsinki, Norway, Austin and Minneapolis-St Paul, from zoom 9. | off |
| Weather & space weather | ||
storms | Tropical cyclones: NASA EONET tracks, NOAA NHC and GDACS forecast cones, watches and warnings, wind fields. | on |
nws | Extreme and severe US weather warnings with their areas (NWS). | on |
aurora | The aurora forecast (NOAA SWPC OVATION). | off |
radar | Precipitation radar (RainViewer). | off |
irsat | Infrared cloud images (NASA GIBS: GOES-East, GOES-West, Himawari). | off |
terminator | Day and night, computed in the browser. | on |
wx_wind | Forecast wind as moving streaks, from NOAA GFS or ECMWF, the same models and code as the globe's weather mode. Any forecast layer opens the timeline bar under the map: drag it from now to +5 days (+3 on phones), play it, switch the model or put both side by side (⇆, with a divider to drag), read the colours, and point anywhere for every field there. | off |
wx_temp | Forecast temperature 2 m above the ground, in colour. | off |
wx_pres | Sea-level pressure as isobars every 4 hPa (heavier every 20) with their values, and the highs (H) and lows (L). | off |
wx_gust | Forecast wind gusts, from a strong breeze (yellow) to hurricane force (purple). | off |
wx_cloud | The model's cloud cover (a forecast, not a satellite picture: irsat shows what is there now). | off |
wx_rain | The model's rain rate in radar colours (a forecast: radar shows what radars see now). | off |
wx_wave | Ocean waves: significant wave height with darts where they run (NOAA WAVEWATCH III with GFS, ECMWF's wave model with ECMWF). | off |
| Infrastructure | ||
cables | Submarine cables (TeleGeography), live through the helper or the public relay, an older copy otherwise. | off |
landing | Where the cables come ashore. | off |
milareas | Military areas (OpenStreetMap via OpenFreeMap's tiles), from zoom 8, named by the military airfields inside. | off |
osm_scan | Results of an area scan: military areas, airfields, nuclear sites and harbours from OpenStreetMap, run from a map probe. | on |
Keys are optional and stored only in your browser, sent only to the provider that issued them: Windy (webcams anywhere), aisstream.io (global ships) and NASA FIRMS (fires). Setup → Test all feeds lists every source with ok, blocked or error and its response time.
The Solar System view
solar.html, or zoom out from the globe past about 300,000 km. Drag to orbit, scroll or pinch to zoom, right-drag (or Ctrl-drag) to move the view, click anything for its card. Planets are drawn at their real size, so zoom in to see them. Click a body to fly to it and ride along with it; Esc or let go leaves the camera where it is. Zoom back in to Earth and the globe takes over again.
The scale band
Along the bottom, one button per rung of the ladder: Earth & Moon, Inner planets, Asteroid belt, Outer planets, Kuiper belt, Voyager, Oort cloud, Nearest stars, Other worlds, Neighbourhood, Milky Way, Local Group, Cosmic web. The current rung lights up as you zoom.
Show
- Planet orbits and Labels.
- Moons: 20 major moons from Mars to Pluto, on orbits fitted to JPL Horizons.
- Dwarf planets, Asteroids (1.57 million from JPL's Small-Body Database, each class switchable: main belt, near-Earth, Jupiter Trojans, Centaurs, Kuiper belt and beyond, Mars-crossers, other) and Comets.
- Spacecraft: trajectories from JPL Horizons, Voyager included. Juno flies its real orbit around Jupiter, skimming the cloud tops at every perijove (its card says when the next one is).
- Eclipses & occultations: the shadows during the solar and lunar eclipses of 2026 to 2030 and the Moon passing in front of bright stars and planets (see below).
- Stars near the Sun (HYG catalogue) and Our radio bubble: how far our broadcasts have travelled since 1920, with the stars inside tinted.
- Planets of other stars: 6,339 exoplanets from the NASA Exoplanet Archive at their stars; fly into a system to see real sizes and the habitable zone.
- Light delay: a ghost of the focused body where Earth sees it, because its light is minutes or hours old.
- Milky Way & galaxies: our galaxy seen from outside and 43,480 galaxies of the 2MASS Redshift Survey, with the big clusters named.
- Graphics: Auto or a fixed level.
Eclipses and occultations, from space
Eclipses & occultations 2026-2030 (left panel) lists every solar and lunar eclipse and every time the Moon covers Aldebaran, Regulus, Spica, Antares, the Pleiades or one of the five bright planets, with where on Earth it is seen. Jump sets the clock to the greatest moment and turns the view to look at it; ▶ plays it from the start at ten minutes a second. During a solar eclipse the Moon's shadow is a dark spot crossing the globe, outlined, with its shadow cones reaching back to the Moon; during a lunar eclipse the Moon turns red inside rings that mark Earth's umbra and penumbra; for an occultation a tube shows the Moon's "shadow" from the star sweeping over Earth. Each event also has a card (search "eclipse 2027" or "Regulus") whose timeline holds its contacts. The Sun and Moon come from NASA JPL Horizons; the times agree with NASA's eclipse canon to within two minutes.
Where is it now?
The search box finds planets, moons, dwarf planets, spacecraft, every comet, about 26,000 named asteroids, nearby stars and other planetary systems, by name, nickname or a near-miss spelling ("Halley", "Juno", "Eros"), and flies there.
Share a view
The address follows what you fly to: copy it, or press the share button on a body's card, and the link opens the same body at the same moment and distance (or live, if the clock was live). The format is in docs/LINK_FORMAT.md.
Wow
Guided tour: Earth to Andromeda, Send a light pulse from the Sun (a shell of light spreads out at 60 times its real speed and names each planet it reaches), Next planetary alignment, and Under the hood: speed, and the positions' error measured live against NASA JPL Horizons. Three lists: Deep-space missions now (every mission with its distance and signal time to Earth, nearest first, and what it does next), Comets: brightest now (the brightest comets with their predicted magnitude and when each peaks, the ones due to peak brighter than magnitude 12 in the next three years, then the best placed ones; magnitudes from JPL's comet parameters, and comets often beat or miss them) and Eclipses & occultations 2026-2030. Comets near the Sun grow a straight blue ion tail and a curved dust tail; the Sun-Earth L1 and L2 points, where SOHO, JWST, Gaia and others work, ride along with Earth. The time bar runs from a year a second backwards to a year a second forwards; planet positions are good from 1800 to 2050.
The download version
The website works with nothing installed. The download adds what a website can't reach: live aircraft and military flights. The ADS-B networks and OpenSky send no permission for web pages to read them and refuse cloud servers, so a small helper on your own computer asks them for you.
- Get
open-overwatch.zipfrom the latest release (about 70 MB) and unzip it into one folder. - On Windows, double-click Start Open Overwatch.bat. On Mac or Linux, run
python3 serve.pyornode serve.jsin that folder. It needs Python 3 or Node 18 or newer. - Your browser opens the map at
http://127.0.0.1:8787/open-overwatch.html; the globe is at/globe.html.
The helper serves the folder on your computer only and relays a fixed list of sources, only for its own pages. It has no dependencies and talks to nothing else. To update, download the new zip.
App, offline and accessibility
- Install it. Where the browser allows (Chrome, Edge, Android) an Install button appears; on an iPhone use Safari's Share menu → Add to Home Screen. It opens full screen with shortcuts to Tonight, Find a flight and the 2D map.
- Offline. Every page and its code is kept once visited, so the app opens with no connection. A banner says when you are offline and how old the saved data is; live feeds are never passed off as fresh. Map tiles you have seen are kept for 30 days.
- Updates. When a new version is published the page offers a reload; nothing changes under you mid-visit.
- Long press (phones) on the globe or the 2D map opens that spot: its coordinates (decimal, degrees-minutes-seconds, MGRS), Copy, a link that opens the globe there with a pin, and on the globe the country and a pin in your drawing. A first-visit card shows the touch gestures once (
?hints=1shows it again). - Keyboard and screen readers. Every page has a skip link and focus rings for the keyboard; toolbars move with the arrow keys; the globe turns, zooms and tilts from the keyboard (see Keyboard); a selected satellite, country, planet or plane is announced once. If your device asks for reduced motion, animations stop and camera flights jump.
The download version leaves the offline copy off unless you open it with ?sw=1 (and ?sw=0 removes it), so several local copies don't get mixed up.
Ask Claude about the Earth
Open Overwatch also comes as a small Model Context Protocol server, so Claude (and other AI apps that speak MCP) can answer questions from the same open data, with 38 tools: earthquakes, where a satellite is and when you can see it, launches, who is in space, asteroid flybys, close approaches in orbit and what is about to re-enter, tropical storms, wildfires, natural events, volcanoes, Baltic ships, bike share, live transit, traffic cameras (with their latest pictures), measured road speeds, submarine cables, country briefings, the weather (with pressure, gusts, waves and whether the models agree), what a plane is and where a flight goes, where any spacecraft, comet or asteroid is, the aurora and the solar wind, flares and storm warnings behind it, tonight's sky, how dark the sky is (light pollution, the nearest darker sky) and the galaxies and clusters within reach tonight, the Sun and Moon, the planets, meteor showers, eclipses, distances, licence-plate readers, military areas, airport weather (METAR and TAF in plain words), sea conditions (ocean buoys and tides) and air quality. Every answer carries a link that opens the globe there, and in Claude Desktop the globe appears in the chat. Install it from open-overwatch.mcpb on the latest release; details in mcp/README.md. It runs on your computer (over stdio, or Streamable HTTP on your own machine for clients that need it), needs no key, and stores nothing. A remote version for claude.ai and ChatGPT connectors, on Cloudflare Workers, is ready in mcp-worker/ but not deployed yet.
Privacy
- No accounts, ads, cookies or analytics. Your settings (layers, keys, folded sections, a rounded location for Tonight) stay in your browser's own storage.
- Your browser talks to the data providers directly to load the map and the data, and to a code CDN (jsDelivr, cdnjs). The fonts are served from this site. Those services can see your IP address under their own policies, and the map area you look at is requested from them.
- Your location (Tonight, Look up, Around me) is used on your device. The cloud forecast for Tonight sends it to Open-Meteo rounded to about 10 km.
- Searches and spoken places send only the words to Photon (komoot). Directions go to the FOSSGIS routing servers; mapped cameras to the public Overpass API; buildings, military areas and plate readers come as map tiles from OpenFreeMap and FlockHopper.
- Aircraft details (type, owner, photo, route) are asked of adsbdb for the plane you open, and cockpit and airport weather of Open-Meteo for the plane's or the field's position. The offline copy lives in your browser's storage only.
- Voice uses your browser's speech recognition: Chrome and Edge send the audio to Google or Microsoft, Safari to Apple. This site receives none of it, and the microphone listens for one command each time you press the mic or V, or while you hold Space.
- The public relay on Cloudflare carries a few feeds a browser can't read directly (NOAA hurricanes, NYC cameras, some camera lists and pictures, cable routes). It carries only those and runs no logging code of its own.
- Weather forecasts come straight from NOAA's and ECMWF's public files on Amazon Web Services; a spoken weather question sends the place it is about to Open-Meteo.
- Photoreal 3D, if you turn it on, uses your own Cesium ion token and sends it only to Cesium. Radio reports each station you start to radio-browser.info.
The full notice, with every service named, is on the landing page.
Limits
Open Overwatch is a hobby project for curiosity and awareness. Never use it for navigation, flying, sailing, driving, emergencies or anything where a late, wrong or missing position could hurt someone. Everything comes from third parties and can be late, incomplete or wrong; positions broadcast by the transmitter itself (aircraft, ships, balloons) can be spoofed.
- Satellite positions come from public element sets that are hours old; the error grows by roughly 1 to 3 km a day.
- Aircraft on the website are only what it can reach (none of the live ADS-B networks); the download version has them.
- Cars in the traffic layer are simulated; only the measured roads in New York and Finland are real readings, and New York's are often a day late.
- Infrared clouds don't cover Europe, Africa or the Indian Ocean; the forecast does.
- Launch replays are reconstructed estimates, not telemetry.